
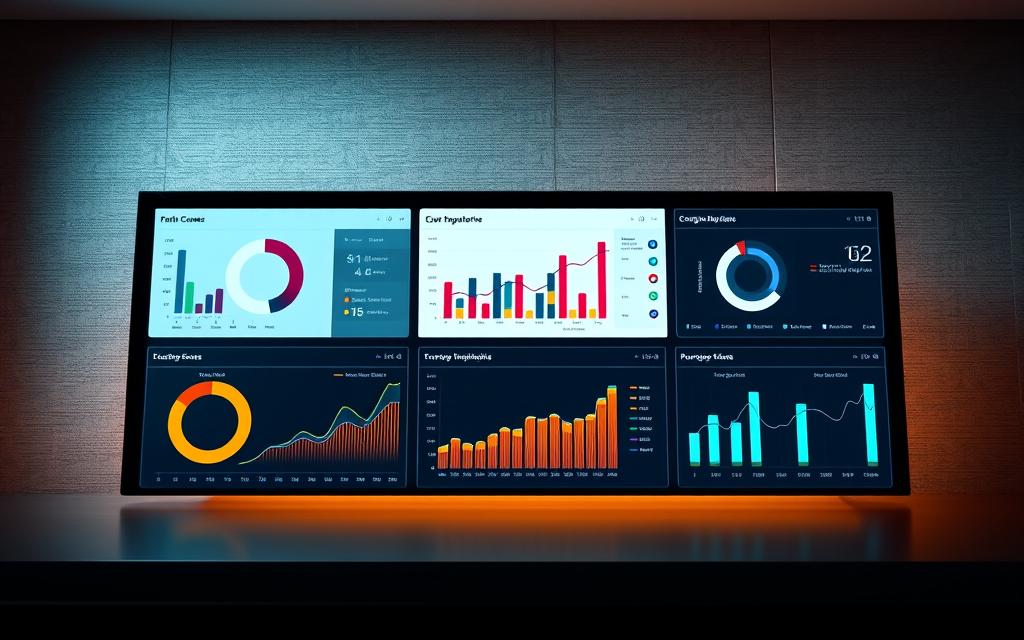
Visibility transforms decision-making. When finance, sales and operations information sits together in a single ERP system, leaders can spot trends and exceptions faster and act with confidence.
For an Indian SME, centralising business data inside sap business one replaces scattered spreadsheets and reduces rework. The system’s reporting and analytics tools provide a practical foundation to measure performance and create timely reports.
This Buyer’s Guide focuses on capabilities that convert information into insights. Expect an overview of dashboards and reports embedded in the ERP cockpit, choices between HANA and SQL platforms, and the core toolset such as Pervasive Analytics, Interactive Analysis, Excel-based options and Crystal Reports.
Practical outcome: faster time to insight, better stakeholder alignment and less effort maintaining multiple reporting silos. Where needs grow, partner expertise helps configure governed models and queries.
Key Takeaways
- Centralising data in sap business one boosts visibility and decision quality.
- Embedded dashboards and reports streamline daily management and oversight.
- Analytics explores data to drive action; reporting monitors performance.
- Choose HANA or SQL based on skills, hosting and total cost of ownership.
- Many teams use prebuilt content and visual tools without extra licences.
Buyer’s Guide overview: navigating SAP Business One analytics today
Business leaders seek tools that turn routine transactions into timely insights without adding complexity. This guide helps Indian small and mid-sized enterprises compare choices and set realistic goals for visibility, reporting and dashboard use.
Who this guide is for
This guide is for Indian SMEs evaluating sap business one to improve visibility across finance, sales and operations. It focuses on practical options that match budgets, skills and hosting preferences.
User intent and outcomes
Readers want clear guidance to move from periodic reports to everyday insight. Expect outcomes such as faster access to centralised data, better information flow to users, and dashboards that surface performance and exceptions.
- Personas: finance, sales and supply chain users who need KPI dashboards and drill-down reports.
- Decision process: understand analytics vs reporting, assess platform choices, compare core tools and evaluate extensions.
- Adoption: emphasise governance so reports remain consistent, audit-friendly and aligned with controls.
Understanding SAP B1 analytics vs reporting
Understanding how interactive exploration differs from fixed reporting helps teams use their ERP data better.
Analytics is the interactive exploration of transactional data to uncover patterns and drive action. Users slice and dice tables, ask follow-up questions and adjust filters to find root causes.
Reporting presents performance in a repeatable, governed layout. Standard reports highlight exceptions, totals and period-over-period figures so teams can steward results and meet audit needs.
Analytics: exploring dynamic data for insights and action
On sap hana, semantic layers expose analytic and calculation views that structure data for fast analysis. These views let authors build dashboards and KPIs without needing to know every table join.
Interactive Analysis opens predefined content in Microsoft Excel as pivot tables with a live connection. The familiar interface speeds investigation while allowing refresh against the source dataset.
Reporting: presenting performance for monitoring and exceptions
Governed reports remain essential where layout, totals and definitions must not change between periods. They support compliance, month-end packs and formal sign-off.
- Dashboards give at-a-glance monitoring and link to drill-through views for deeper review.
- A finance user can analyse margins by customer segment interactively, then use a governed report for the official month‑end statement.
- Using structured views aligns definitions like revenue or costs across the business, reducing conflicting interpretation.
Both approaches complement each other: exploration drives investigation and action, while reporting underpins stewardship. Platform choice will influence which tools are available; the next section examines those options.
SAP B1 analytics platform choices: SAP HANA vs SQL
The platform under your ERP decides how much native interactivity, real-time refresh and embedded actions are available.
HANA advantages: the HANA edition of sap business one includes pervasive analytics and an Interactive Analysis builder. Dashboards can trigger actions — opening advanced views, launching Enterprise Search or linking charts alongside a transaction — which reduces context switching for users.
HANA also exposes analytics views modelled as a star schema. That structure speeds aggregated reporting and makes graphical builders more effective for everyday analysis. Users can refresh Excel pivots live against the source for quick investigation.
SQL route and partner tools
On SQL, partners supply cockpit dashboards and drill-through features. Tools such as Boyum B1 Dashboards recreate many interactive experiences, while custom queries feed Excel pivots and governed reports.
- HANA: native pervasive analytics, GUI-driven builders, embedded actions.
- SQL: partner dashboards, custom queries, flexible deployment.
- Both: governed reporting layer and the need for queries to define bespoke measures.
Cost, skills and hosting: HANA can demand more on-premise infrastructure and specialised skills. Cloud hosting or partner-managed services reduce that burden for either platform. Choose based on existing team skills, partner ecosystem and long-term supportability.
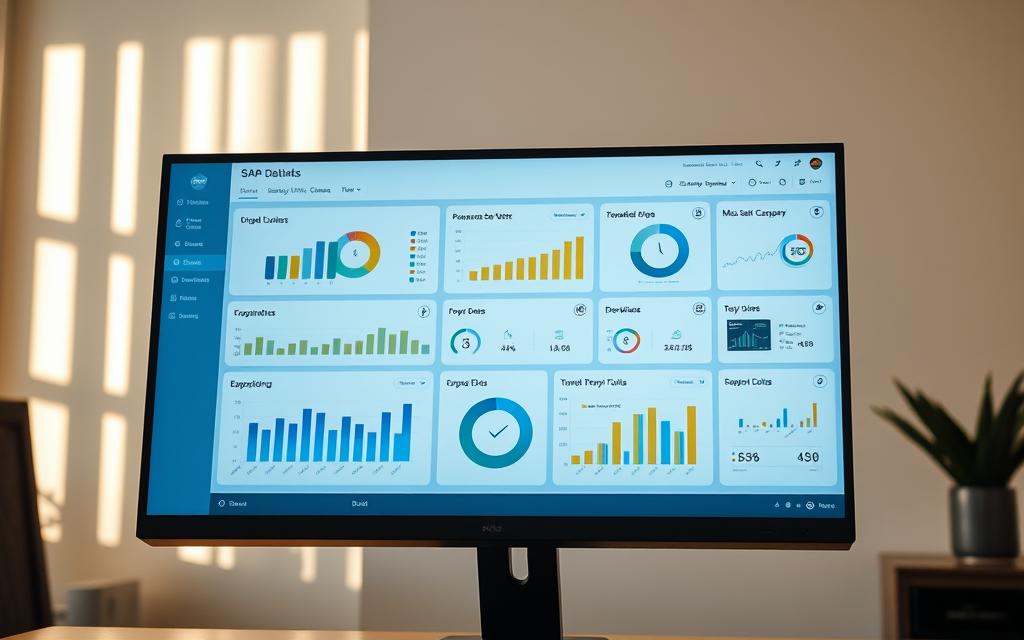
Core analytics tools inside SAP Business One
Everyday users rely on built-in viewers and Excel integrations to ask questions of live business data. The Pervasive Analytics Designer surfaces cockpit-ready dashboards and KPIs so teams can monitor performance without leaving the transaction screen.
Interactive Analysis powered by Excel pivots
Interactive Analysis (HANA) opens predefined content as Excel pivot tables with a live connection. Users pivot fields freely and refresh to reflect current transactions, lowering training time because the Excel interface is familiar to finance and sales teams.
Excel Reports for live, refreshable insights
Excel Reports use semantic layers to deliver governed, refreshable workbooks. Pre-delivered templates speed common use cases and new reports are created via Tools → Excel Reports and Interactive Analysis Designer.
Crystal Reports for governed outputs
Crystal Reports provides formatted, audit-friendly reports with scheduling and export options. It serves as the reporting backbone for period-end packs while self-service tools handle day-to-day review.
- KPIs sourced from analytic or calculation views keep definitions consistent.
- Dashboard actions open master records or chain to advanced views for deeper review.
- Authorisations apply to underlying content so sensitive data shows only to permitted users.
| Tool | Best for | Key feature |
| Pervasive Analytics | Operational monitoring | Cockpit KPIs, in-line actions |
| Interactive Analysis | Ad-hoc investigation | Live Excel pivots |
| Excel Reports | Refreshable workbooks | Semantic-layer governance |
| Crystal Reports | Formal reporting | Formatted, schedulable outputs |
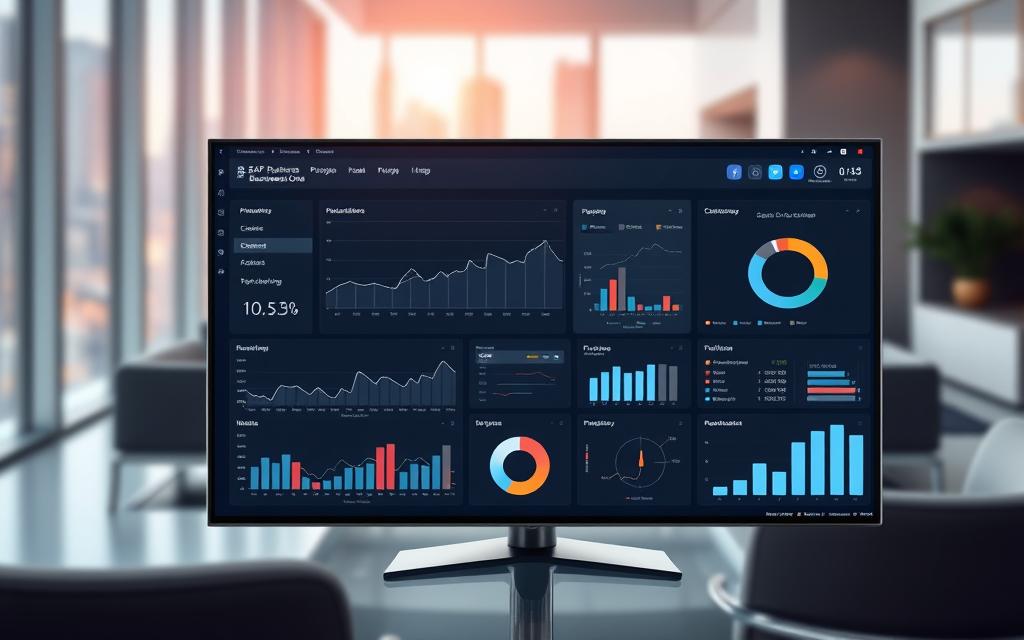
Extending your analytics stack: SAP Analytics Cloud and SAP Lumira
Extending the reporting stack with cloud tools helps teams align on metrics and act faster across functions. These tools sit above sap business one to offer story-driven views and richer visual discovery while complementing cockpit dashboards and Excel workflows.
When to use SAP Analytics Cloud for real-time stories and collaboration
SAP Analytics Cloud is a cloud extension that connects to sap business source data, enriches it and produces interactive stories. Users author in a browser, comment, and share without installing desktop software.
Choose this platform for cross-functional planning, executive storytelling and collaborative review where many users must view the same narrative and metrics.
Visual analysis with SAP Lumira: storyboards, infographics and sharing
SAP Lumira focuses on rapid visual discovery. Users acquire business one data, cleanse and enhance it, then build storyboard-style outputs and infographics for presentations.
- Use semantic layers and curated views to keep definitions consistent with in-system reporting.
- Confirm which datasets are approved for external visualisation and align security before publishing.
- Plan refresh strategies carefully: real‑time access depends on the connection type and can affect source system performance.
| Tool | Best fit | Strength |
| SAP Analytics Cloud | Enterprise storytelling | Browser authoring, collaboration |
| SAP Lumira | Visual discovery | Storyboard and infographic creation |
| Pervasive Analytics / Excel Reports | Operational monitoring & governed workbooks | In‑ERP dashboards and refreshable Excel |
SAP B1 analytics: selection criteria, use cases and best-fit scenarios
A clear selection framework ties platform trade-offs to real, daily use cases across sales, finance and operations.
Selection criteria should balance embedded vs partner options, the need for in‑ERP actions and the split between self‑service and governed reporting.
- Choose pervasive, in‑cockpit dashboards when users need quick actions from a transaction screen.
- Pick partner dashboards on SQL if you need custom visual storytelling or add‑on features from the partner ecosystem.
- Use Interactive Analysis and Excel Reports for finance teams that rely on pivot exploration and consistent period‑end views.
Sales pipeline, finance and operations: practical dashboards and KPIs
Sales dashboards surface pipeline values, top leads by deal size and let leaders drill through to business partner details.
Finance use cases include margin variance, cash collections and reconciled month‑end packs built from semantic views to keep figures consistent.
Operations monitors overdue deliveries, stock coverage and on‑time shipment rates with cockpit alerts that trigger review workflows.
Governance, authorisations and user adoption considerations
Define measures in semantic layers so reports and dashboards use the same logic across teams.
Authorisations are enforced at the dashboard level; users without rights do not see restricted content.
| Need | Best fit | Benefit |
| Embedded actions | In‑ERP dashboards | Faster resolution from the cockpit |
| Pivot investigation | Interactive Analysis / Excel Reports | Familiar Excel workflows |
| Custom visuals | Partner tools (SQL) | Flexible storytelling |
Start with role‑based dashboards, run short pivot training and pilot a small set of critical views before scaling. Document KPI definitions so discussions focus on improvement, not numbers.
Implementing and scaling analytics in India with SAP Business One
Start with clear KPIs and simple cockpit views to make everyday decisions faster for finance and sales teams. Work with a qualified sap business one partner in India to define measures that reflect local tax and compliance rules.
Partnering for success: queries, views and dashboard design
Partner consultants author semantic views and write queries that feed dashboards and reports. These partner-built queries reduce duplicated logic and keep definitions consistent across cockpit tiles and Excel workbooks.
Integration pathways: Excel, add‑ons and external platforms
Use the tight Excel integration for Interactive Analysis and excel reports so finance and operations work from refreshable workbooks. On SQL systems, partner add-ons such as Boyum B1 Dashboards provide cockpit visualisations alongside existing reporting assets.
- Phase delivery: role-based cockpits first, then advanced dashboards.
- Govern queries and views with version control and peer review.
- Connect e-commerce platforms (Magento, Shopify) via connectors to sync items, orders and customers into sap business one.
- Train users on cockpit use, pivots and how to request enhancements; gather feedback and iterate.
| Step | Benefit | Owner |
| Define KPIs & views | Consistent figures across reports | Partner + Finance |
| Pilot role cockpits | Fast user adoption | Business Managers |
| Govern & train | Data quality and sustainment | IT + Power Users |
Conclusion
Close alignment between KPIs, platform choice and governance turns raw system data into timely business decisions.
This Buyer’s Guide helps you distinguish analytics from reporting, weigh HANA versus SQL routes, and match tools to team skills. Use cockpit dashboards for day‑to‑day monitoring, Crystal Reports for audit‑ready outputs and extensions like SAP Lumira or cloud stories where wider collaboration is needed.
Practical next steps: define priority KPIs, validate semantic views, choose hosting and engage a partner for custom queries. Enforce authorisations so sensitive information stays protected while users gain visibility and fast access to results.
When sap business one embeds timely reporting and governed data into daily work, business teams act faster, with more confidence and better performance.